
Media Impact Index
Explore how comic book prices move around film, television, animation, and publishing milestones. Find a book, follow its timeline, and see what the recorded sales show.
One defined edition and grade per study. Every analysis includes its data capture date and methodology.
Explore the studies
Browse the library · Page 1 of 4
-
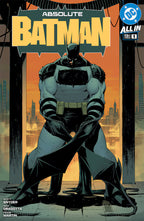
View study : Absolute Batman #1
Collector demand rose before the animation announcement. The screen cycle is still in progress.
Data captured Sep 15, 2026
-
View study : Amazing Spider-Man (2014) #4
Tracks CGC 9.8 sales through Sony’s Silk film and live-action television development cycle, from the 2018 film report to the 2024 cancellation.
Data captured Oct 01, 2026
-
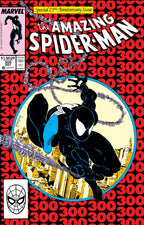
View study : Amazing Spider-Man #300
Tracks Amazing Spider-Man #300 around Sony's first Venom solo film, from Tom Hardy's casting through the 2018 theatrical release.
Data captured Sep 17, 2026
-
View study : Eternals #1
A pre-release surge faded; the later snapshot returned near the selected pre-development baseline.
Data captured Sep 15, 2026
-
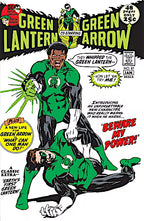
View study : Green Lantern (Vol. 2) #87
John Stewart's first appearance through the announcement, casting, marketing and launch of HBO's Lanterns.
Data captured Sep 16, 2026


No studies match yet.
Try a character name, a shorter title, or clear the filters.
Start with these studies
New Mutants #98
Deadpool's announcement, release, and the price baseline observed one year later.
Explore the Deadpool study → The rise and the retreatEternals #1
A long climb, a decline that began before release, and a later return near the selected baseline.
Explore the Eternals study → A cycle in progressAbsolute Batman #1
Publishing hype and animation news overlap in the market for a recent first issue.
Explore the Batman study →Follow the evidence.
Each study pairs recorded sales with sourced milestones, identifies the exact edition and CGC grade, and explains its baseline and comparison windows. Open any study's Sources & methodology section for the capture audit and calculations.
Monthly or quarterly medians describe the observed trading pattern. Small samples, incomplete periods, and overlapping news are disclosed. Timing alone does not establish cause, and different books' percentage changes are not a controlled performance ranking.
These are dated research snapshots, not live price quotes or predictions. Start with Shang-Chi's methodology to see how we handle a less frequently traded book.